
Once you have set your search area you can easily visually review analytics in REALM.
To view analytics on a mobile:
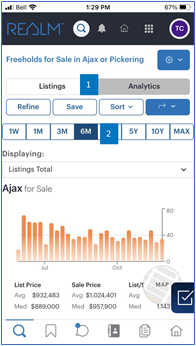
- Select Analytics from the menu bar after defining the area(s) of interest.
- Select a time range (1W, 1M, 3M, 6M, 1Y, 5Y, 10Y, Max).
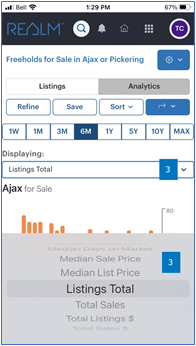
- Select the down arrow to select the metric you are interested in (Listings Total, Avg Ask / Sell, Ratio, Avg Day on Market, Avg Sale Price, Median Ask/Sell Ratio, Median Days on Market, Median Sale Price, Median List Price, Listing Total, Total Sales, Total Listings $, Total Sales $0).
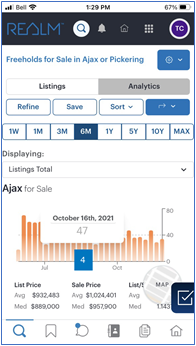
- Hover over any bar in the graph to find statistics for that timeframe.
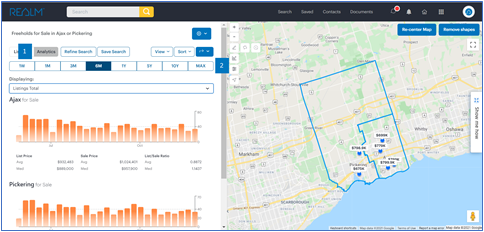
To view analytics on a computer:
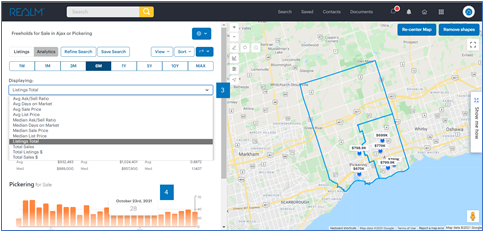
- Select Analytics from the menu bar after defining the area(s) of interest.
- Select a time range (1W, 1M, 3M, 6M, 1Y, 5Y, 10Y, Max).
- Select the down arrow to select the metric you are interested in (Listings Total, Avg Ask / Sell, Ratio, Avg Day on Market, Avg Sale Price, Median Ask/Sell Ratio, Median Days on Market, Median Sale Price, Median List Price, Listing Total, Total Sales, Total Listings $, Total Sales $0).
- Hover over any bar in the graph to find statistics for that timeframe.
Note: Analytics are for visual reference only and cannot be printed or saved.
If you have any questions, please contact us at Help@REALMmlp.ca.